|

|  WinDbg Overview: How to Install, Pros & Cons, Price

WinDbg Overview: How to Install, Pros & Cons, Price

November 14, 2024

Explore WinDbg: installation, pros & cons, pricing, supported devices, and FAQs tailored for firmware developers. Uncover why WinDbg is essential for debugging.

What is WinDbg

  Overview of WinDbg  

  • WinDbg, short for Windows Debugger, is a powerful debugging tool primarily designed for developers and engineers to troubleshoot code, perform advanced analysis of the Windows operating system, and debug applications both in user and kernel mode.
  •  
  • Although widely recognized for its use in software debugging, it also serves as a critical asset for firmware engineers, particularly due to its ability to tap into the lower levels of system operation.
  Key Features of WinDbg  
  • Provides direct access to Windows kernel, allowing in-depth analysis and troubleshooting of system-level interactions.
  •  
  • Supports live debugging of user-mode applications, kernel-mode drivers, as well as post-mortem analysis of crash dumps, which is highly beneficial for debugging firmware issues.
  •  
  • Comes equipped with a robust set of commands and extensions, enabling engineers to dissect complex data structures and control system operations intricately.
  Usage in Firmware Engineering  
  • Firmware engineers leverage WinDbg for its ability to interface with hardware through the debugging extensions, facilitating comprehensive analysis of hardware-software interactions.
  •  
  • Through the support of symbol files and a variety of commands, WinDbg aids firmware developers in identifying and resolving low-level bugs efficiently, which are often overlooked by standard debuggers.
  •  
  • Possesses capabilities to simulate hardware behavior and introduce fault scenarios to validate firmware robustness, proving indispensable in preemptive error detection and system optimization.
  Advanced Debugging Techniques  
  • WinDbg offers scripting capabilities to automate complex debugging processes, saving time and increasing accuracy for firmware analysis tasks.
  •  
  • Through the integration with other debugging tools and frameworks, it extends its utility beyond traditional debugging, thus providing extended functionality crucial for firmware engineers working on multifaceted projects.
  ``` kd ```  

What is WinDbg Used for

  Role of WinDbg in Firmware Development  

  • WinDbg is extensively used by firmware engineers for debugging low-level system code, including diagnosing issues at the kernel level.
  • It assists in analyzing crash dumps (both live and post-mortem) to find the root causes of system crashes.
  • Firmware developers utilize WinDbg to inspect the interactions between hardware and software by stepping through code execution and examining memory states.
  • WinDbg's capability to connect to a target machine over a serial interface makes it invaluable for debugging firmware in real-time.
  • Developers often rely on WinDbg to set breakpoints, examine variable values, and trace function calls to resolve complex firmware behavior issues.
  Current Relevance of WinDbg  
  • WinDbg remains a vital tool in the debugging arsenal of firmware engineers, even in 2023, due to its rich feature set tailored for low-level debugging.
  • Despite the availability of newer tools, WinDbg's compatibility with a wide range of Windows platforms makes it indispensable for many development scenarios.
  • Frequent updates by Microsoft ensure that WinDbg evolves to support the latest hardware and Windows features, thus maintaining its relevance.
  • Its integration with Microsoft’s Debugging Tools for Windows and support for remote debugging further solidifies its continued use in the industry.
  • For developers working on complex systems where understanding hardware-software interactions is crucial, WinDbg is still considered state-of-the-art.
 

Omi Necklace

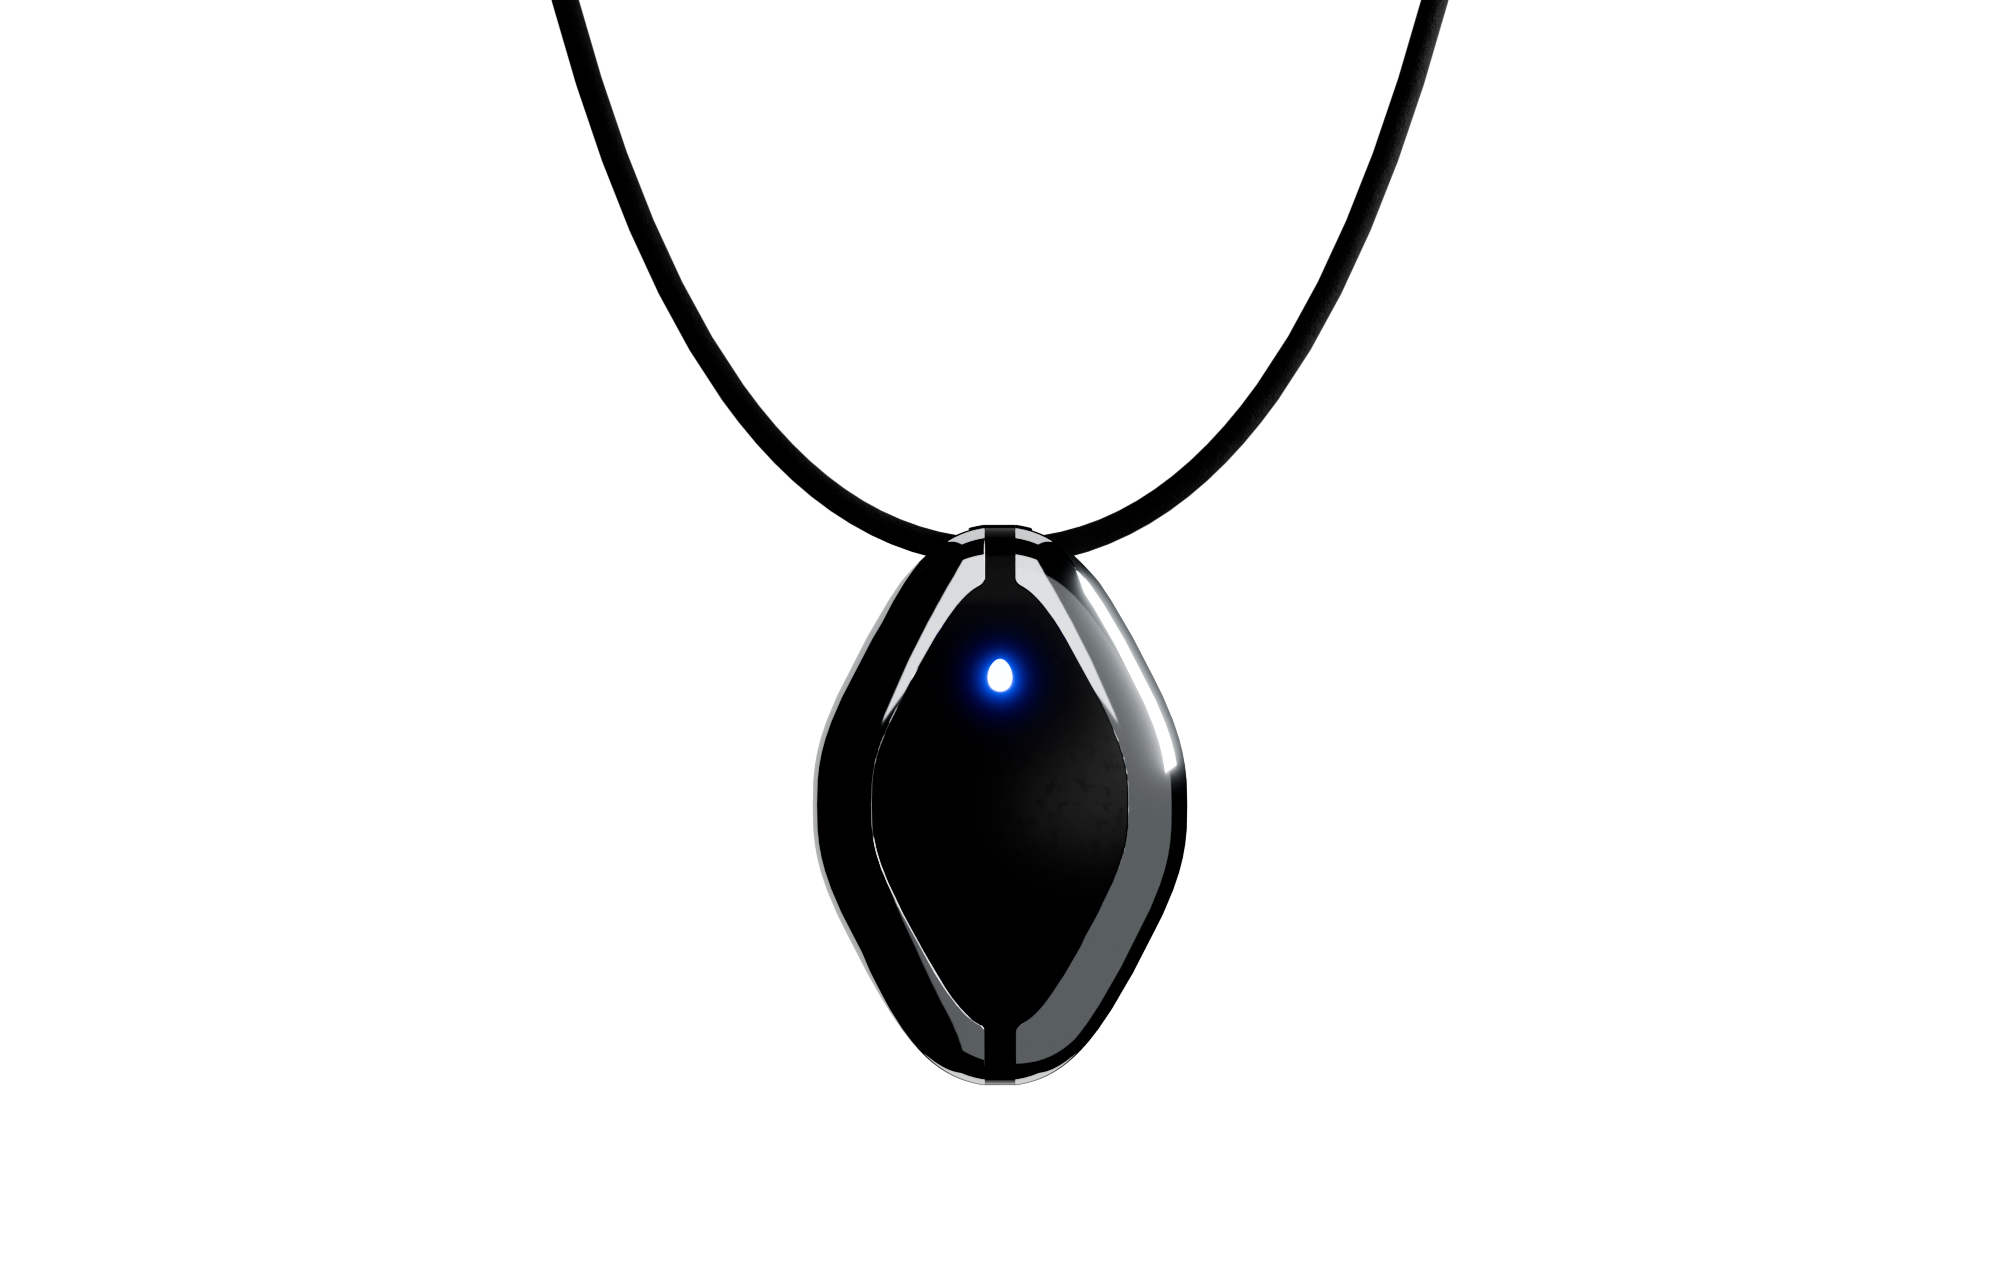
The #1 Open Source AI necklace: Experiment with how you capture and manage conversations.

Build and test with your own Omi Dev Kit 2.

Is WinDbg Free

  Is WinDbg Free  

  • Yes, WinDbg is a free tool available from Microsoft.
  Is WinDbg Free for Commercial Use  
  • Yes, WinDbg is free for commercial use as well.
 

What Devices Support WinDbg

  WinDbg Overview  

  • WinDbg is a powerful and versatile debugging tool that supports both kernel-mode and user-mode debugging.
  • Primarily used by firmware and driver developers to debug Windows operating systems.
  Supported Devices  
  • Personal Computers: WinDbg runs on various Windows operating systems from Windows XP to the latest versions, supporting debugging on the actual machine on which the debugger runs.
  • Virtual Machines: Can be used in virtualized environments using software like VMware Workstation, Hyper-V, and VirtualBox. This enables debugging on guest operating systems.
  • Remote Computers: Supports remote debugging, enabling debugging on a machine that is separate from the target machine. This is often done over a network.
  • Serial Connections and USB: Common setup for kernel-mode debugging, requiring a serial cable or USB cable to connect the target and host machines.
  • Network Cables (Ethernet): Network debugging uses an Ethernet cable or connection, allowing the host machine to connect to a debug target over a physical or Wi-Fi network.
  Specialized Devices and Environments  
  • Embedded Systems: Supports debugging of Windows Embedded operating systems, used in specialized hardware environments.
  • Microsoft Azure: Integration with Azure Virtual Machines for debugging issues in the cloud environment.
  Additional Considerations  
  • Symbol Packages: For full functionality, ensure that symbol packages are properly configured to get accurate and detailed information during a debugging session.
  • Software Packages: Combine with other debugger extensions and plug-ins to enhance debugging functionality and target analysis capabilities.
 

Pros and Cons of WinDbg

Comprehensive Debugging Capabilities

  • WinDbg offers a powerful suite of debugging tools that supports advanced debugging scenarios such as kernel mode, crash dumps, and live debugging, which can often surpass other tools in detailed system analysis. This extensive capability is a crucial advantage for firmware engineers who require deep insight into system operations.

Advanced Scripting Support

  • The tool has robust scripting capabilities through its debugger scripting engine. These allow users to automate repetitive tasks and customize the tool according to specific needs, which can be a substantial edge over other debugging tools that may lack such flexibility.

Wide Range of Supported Architectures

  • WinDbg supports a broad spectrum of system architectures, making it versatile for different types of firmware projects. Compared to other debugging tools that may focus narrowly on certain systems, WinDbg's flexibility ensures it can be used across various platforms.

Steep Learning Curve

  • WinDbg has a complex interface and a steep learning curve, often requiring significant time investment to gain proficiency. This can be a disadvantage when compared to more user-friendly tools that offer intuitive interfaces for faster onboarding of new users.

Performance Overhead

  • In some scenarios, WinDbg can introduce performance overhead during debugging sessions, especially when dealing with large and complex systems. Alternative tools might provide more efficient debugging with less impact on system performance during these sessions.

Limited Support for High-Level Language Integration

  • While WinDbg excels in low-level debugging, it lacks seamless integration with high-level programming languages. Compared to modern integrated development environments (IDEs) with built-in debugging features, it may not provide the same ease of use for languages like Python or Java, which can be a limitation for multi-language development environments.

Omi App

Fully Open-Source AI wearable app: build and use reminders, meeting summaries, task suggestions and more. All in one simple app.

Github →

How to Install WinDbg

  Introduction to WinDbg  

  • WinDbg is a powerful debugger for Windows, often used by firmware engineers to analyze and debug drivers, systems, and memory dumps.
  Download WinDbg  
  • Access the Windows Driver Kit (WDK) for your Windows version from the official Microsoft website.
  • The Windows Software Development Kit (SDK) also contains WinDbg. Visit the Microsoft website and download the SDK that includes WinDbg.
  Install the Windows SDK or WDK  
  • Run the downloaded SDK or WDK setup executable.
  • During installation, select the "Debugging Tools for Windows" feature specifically to install WinDbg.
  • Follow the on-screen instructions to complete the installation. Ensure you have the necessary permissions to modify your system settings.
  Open WinDbg  
  • Navigate to the installation directory where WinDbg is installed, typically located in your SDK or WDK folder under "Debuggers".
  • Run the "WinDbg.exe" executable to open the tool.
  Configure Symbol Paths  
  • Symbols are essential for debugging. You can set the symbol path in WinDbg by going to the "File" menu and choosing "Symbol File Path".
  • Enter Microsoft's public symbol server address: SRV_C:\Symbols_https://msdl.microsoft.com/download/symbols
  • Ensure your system has internet access to download symbols when needed.
  Verify the Installation  
  • Open WinDbg and use .sympath command to confirm that symbol paths are set correctly.
  • Load a test dump file or executable to ensure that symbols are being correctly located and loaded by the debugger.
  Resources and Documentation  
  • Explore the "Help" section within WinDbg for documentation and tutorials on using various features.
  • Access online resources and forums dedicated to WinDbg for community guidance and support.
 

WinDbg FAQ

What are the system requirements for running WinDbg efficiently, and are there any specific hardware or software configurations that improve its performance for firmware debugging?

  System Requirements for WinDbg  

  • Windows OS: Minimum Windows 7; Windows 10/11 recommended for optimal support.
  •  
  • Memory: At least 8GB RAM; 16GB or more preferred for handling large dump files.
  •  
  • CPU: Modern multicore processor to enhance parallel data operations.
  •  
  Improving Performance for Firmware Debugging  
  • SSD Storage: Faster disk access speeds improve dump file operations.
  •  
  • Multiple Monitors: A multi-display setup facilitates concurrent code and debugging window management.
  •  
  • Networking: High-speed network for efficient remote debugging and symbol file access.
 

How does WinDbg integrate with existing development environments or tools, and are there any recommended plugins or extensions that enhance its functionality for low-level debugging?

  Integration with Development Environments  

  • WinDbg works seamlessly with Visual Studio via the "Debugging Tools for Windows" component, allowing smooth transition between debugging sessions.
  •  
  • It also supports integration with build systems like makefiles using command-line automation, enhancing automated debugging workflows.
  Recommended Plugins and Extensions  
  • The WinDbg Preview extension offers an improved UI and modern features like scripting support with JavaScript and Python.
  •  
  • Extensions like SOSEX and pykd enhance capabilities for .NET debugging and low-level script access, respectively.
 

What types of symbol files and source code access do I need to ensure effective debugging with WinDbg, and how can I manage symbol paths or configurations to optimize the debugging process?

  Symbol Files  

  • Use both Microsoft Symbol Servers & custom symbol files matching your build: .pdb files are essential for understanding call stacks.
  Source Code Access  
  • Ensure source indexing: SRCSRV & proper source path mapping enable line-to-line debugging.
  Managing Symbol Paths  
  • Set _NT_SYMBOL\_PATH environment variable for efficient symbol retrieval.  .sympath command in WinDbg also allows dynamic path changes.
  Optimize Configurations  
  • Leverage symbol caching for improved performance by utilizing _NT_SYMCACHE\_PATH.
 

Order Friend Dev Kit

Open-source AI wearable
Build using the power of recall

Order Now

Join the #1 open-source AI wearable community

Build faster and better with 3900+ community members on Omi Discord

Participate in hackathons to expand the Omi platform and win prizes

Participate in hackathons to expand the Omi platform and win prizes

Get cash bounties, free Omi devices and priority access by taking part in community activities

Join our Discord → 

OMI NECKLACE + OMI APP
First & only open-source AI wearable platform

a person looks into the phone with an app for AI Necklace, looking at notes Friend AI Wearable recorded a person looks into the phone with an app for AI Necklace, looking at notes Friend AI Wearable recorded
online meeting with AI Wearable, showcasing how it works and helps online meeting with AI Wearable, showcasing how it works and helps
App for Friend AI Necklace, showing notes and topics AI Necklace recorded App for Friend AI Necklace, showing notes and topics AI Necklace recorded

OMI NECKLACE: DEV KIT
Order your Omi Dev Kit 2 now and create your use cases

Omi Dev Kit 2

Endless customization

OMI Necklace

$69.99

Make your life more fun with your AI wearable clone. It gives you thoughts, personalized feedback and becomes your second brain to discuss your thoughts and feelings. Available on iOS and Android.

Your Omi will seamlessly sync with your existing omi persona, giving you a full clone of yourself – with limitless potential for use cases:

  • Real-time conversation transcription and processing;
  • Develop your own use cases for fun and productivity;
  • Hundreds of community apps to make use of your Omi Persona and conversations.

Learn more

Omi Dev Kit 2: build at a new level

Key Specs

OMI DEV KIT

OMI DEV KIT 2

Microphone

Yes

Yes

Battery

4 days (250mAH)

2 days (250mAH)

On-board memory (works without phone)

No

Yes

Speaker

No

Yes

Programmable button

No

Yes

Estimated Delivery 

-

1 week

What people say

“Helping with MEMORY,

COMMUNICATION

with business/life partner,

capturing IDEAS, and solving for

a hearing CHALLENGE."

Nathan Sudds

“I wish I had this device

last summer

to RECORD

A CONVERSATION."

Chris Y.

“Fixed my ADHD and

helped me stay

organized."

David Nigh

OMI NECKLACE: DEV KIT
Take your brain to the next level

LATEST NEWS
Follow and be first in the know

Latest news
FOLLOW AND BE FIRST IN THE KNOW

San Francisco

team@basedhardware.com
Title

Company

About

Careers

Invest
Title

Products

Omi Dev Kit 2

Openglass

Other

App marketplace

Affiliate

Privacy

Customizations

Discord

Docs

Help